
This assessment provides an evidence base to support biomethane and other renewable fuels development in Victoria by identifying where sustainable biomass resources are available and how they could contribute to renewable gas supply.

It examines a range of feedstocks - including agricultural residues, forestry and wood processing residues, organic municipal waste, wastewater and landfill gas - and considers their practical availability, competing uses and geographic distribution.

Together with an interactive data visualisation, the assessment helps industry, government and stakeholders better understand the realistic potential for biomethane and other renewable fuel production across Victoria.

Victoria's Potential Biomass Resource
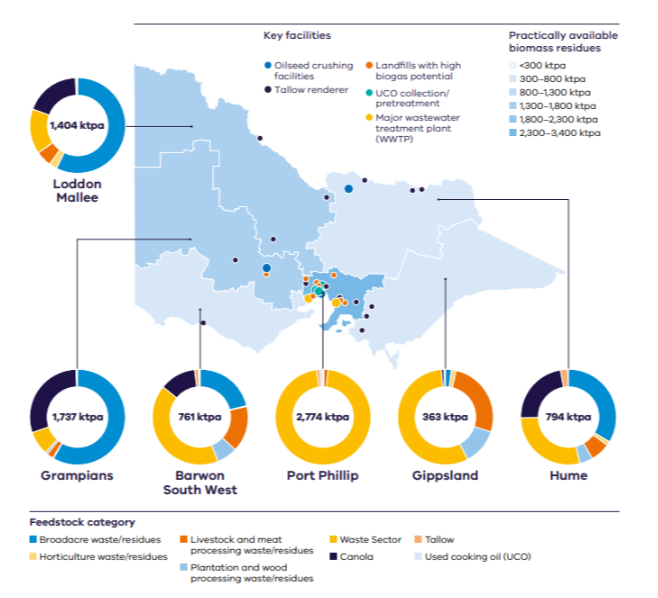
This graphic is from the Renewable Fuels and Feedstocks Investment Prospectus and has been developed from Victoria's Biomass and Biomethane Potential Assessment and additional analysis.
Victoria's Potential Biomass Resource

An infographic map of Victoria, Australia, illustrating regional biomass and biomethane potential. The map is shaded to indicate ranges of practically available biomass residues and includes symbols identifying renewable fuel-related infrastructure, including oilseed crushing facilities, tallow renderers, landfills with high biogas potential, used cooking oil pretreatment facilities, and major wastewater treatment plants.

Six donut charts display the estimated annual biomass resource potential (kilotonnes per annum, ktpa) for each region:

  • Port Phillip: 2,774 ktpa (largest resource)
  • Grampians: 1,737 ktpa
  • Loddon Mallee: 1,404 ktpa
  • Hume: 794 ktpa
  • Barwon South West: 761 ktpa
  • Gippsland: 363 ktpa (smallest resource).

The donut chart segments show contributions from different feedstock categories, including broadacre crop residues, horticultural residues, livestock and meat processing waste, plantation and wood processing waste, waste sector materials, tallow, canola, and used cooking oil. Port Phillip is dominated by waste-sector feedstocks, while regional areas show a mix of agricultural, forestry, livestock, and oilseed-related feedstocks.

A legend explains the facility symbols, feedstock categories, and biomass volume ranges represented on the map.

Download image

What the assessment covers

The assessment examines biomass resources including:

  • agricultural residues
  • forestry and wood processing residues
  • organic municipal solid waste
  • biogas collected from wastewater and landfill gas.

The analysis considers:

  • theoretical and practically available biomass
  • geographic distribution of biomass across Victoria
  • biomethane production potential across Victoria.

Data visualisation

The MapShare website features an interactive biomethane potential data visualisation that accompanies the report and allows users to explore:

  • biomethane, measured in terajoules, by local government areas and regions
  • biomass categories
  • biomethane energy potential over different timeframes.

Page last updated: 27/10/26